Spooky Halloween Spider Plots
Spider Plots (aka Tas Plots)
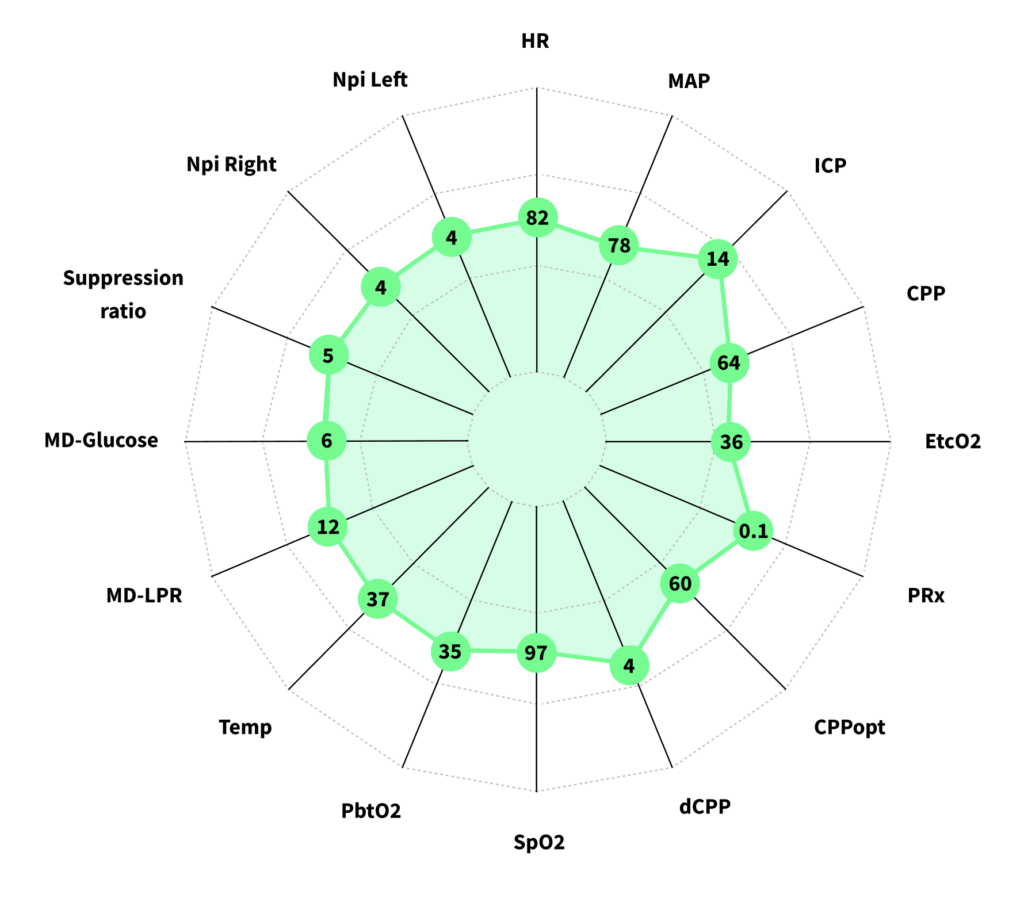
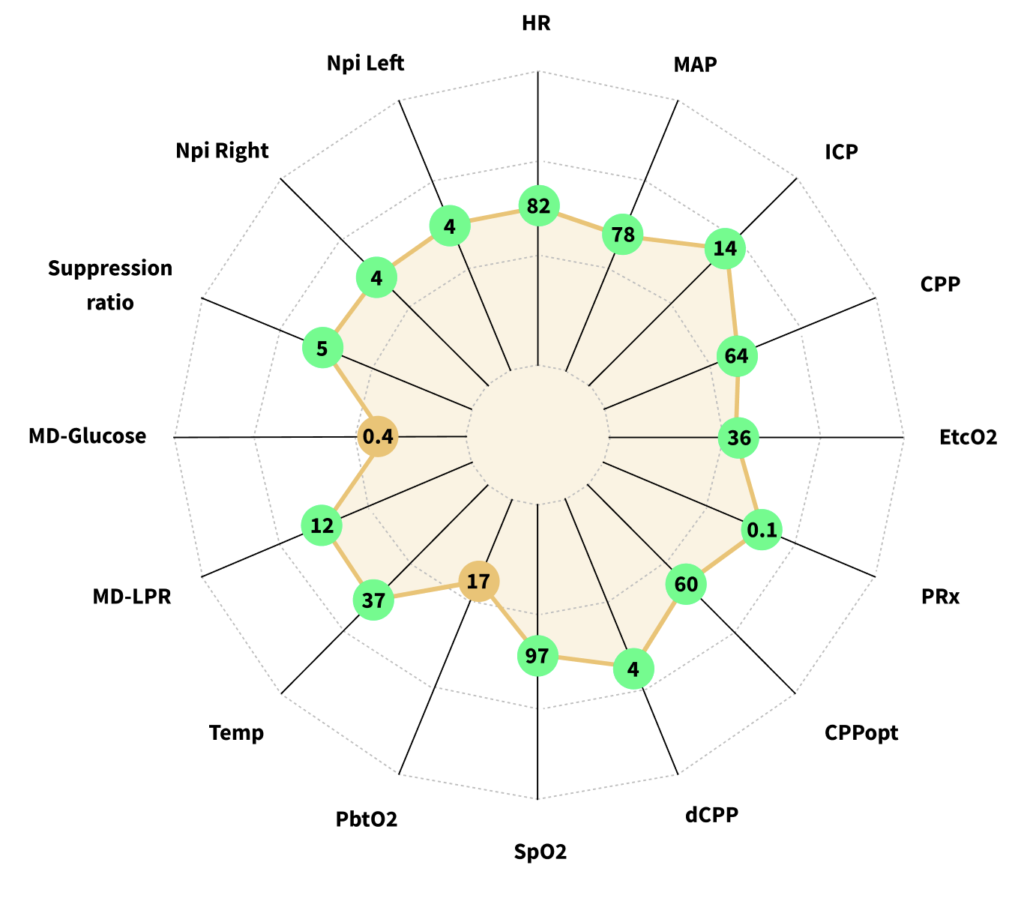
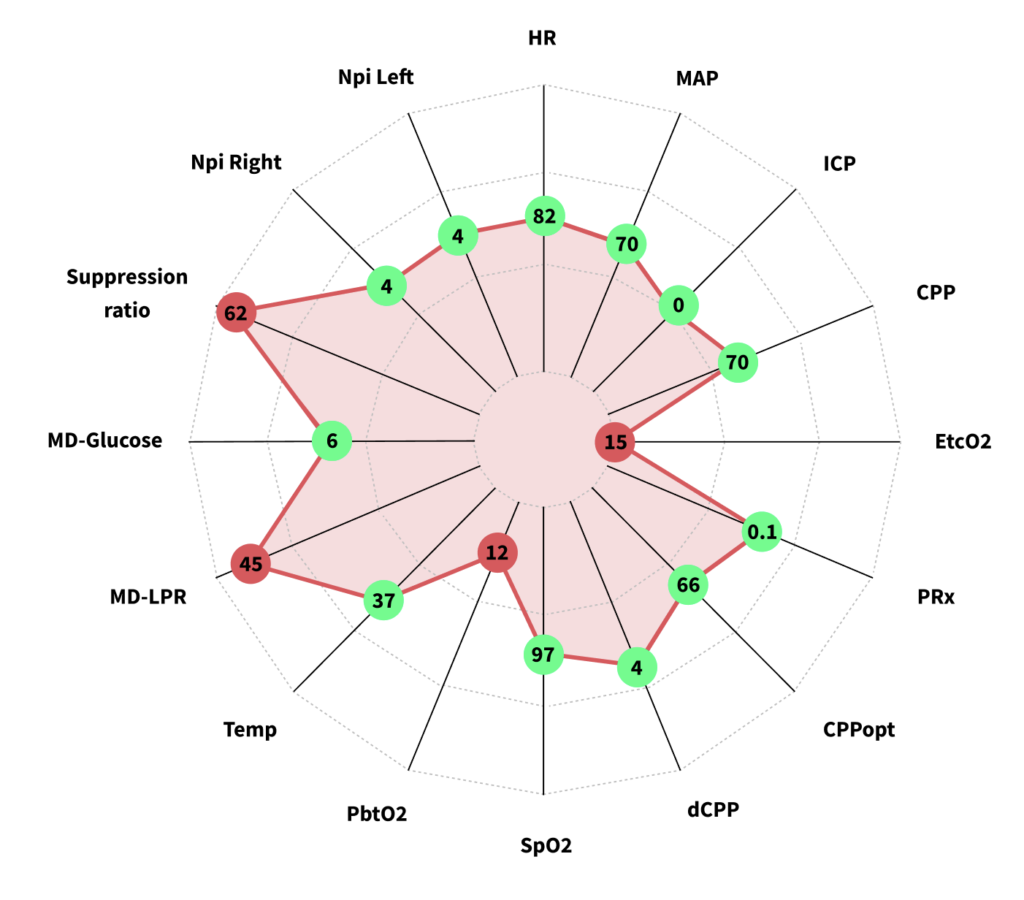
In the spirit of Halloween, we’re excited to showcase some concepts that we have been developing over the past several months. Our team has been working closely with our friends Dr. Jeanette Tas and Dr. Raimund Helbok from Linz, Austria to design new ways of displaying data. In particular, one of the visualizations that we created uses Spider Plots as a way to leverage pattern recognition when certain measurements are out of clinical range. In the same way that great chess players recognize patterns during a game when deciding their next move, we aim to train nurses to associate different pathological states with treatment protocols and clinical actions.
We have informally named these “Tas Plots” to highlight the close collaboration between us and Dr. Jeanette Tas. Displays like these can be used at bedside to quickly overcome multimodal mayhem and information overload.
Stable situation with all parameters in range:

Bad situation with low brain oxygen and low glucose:

Critical situation with low end-tidal CO2, low intracranial pressure, high lactate-pyruvate ratio, low brain oxygen, and high suppression rate:

Special thank you to our collaborators in Linz for their continued support and feedback in developing these novel multimodal displays: Department of Neurology, Kepler University Hospital, Johannes Kepler University Linz, Austria, Clinical Research Institute for Neuroscience, Johannes Kepler University Linz, Austria.


